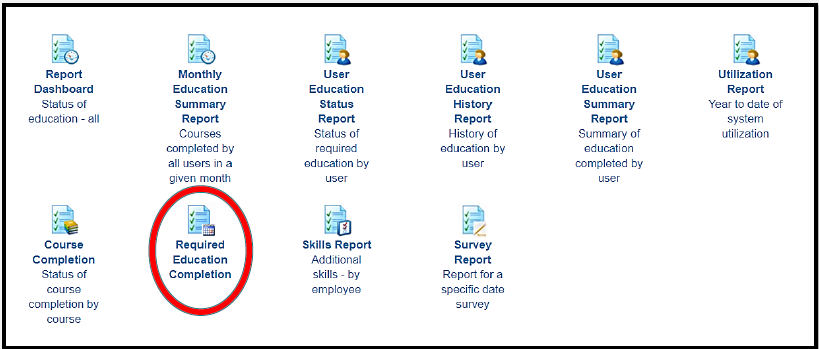
Required Education Completion shows you the percentage of completion BY COURSE

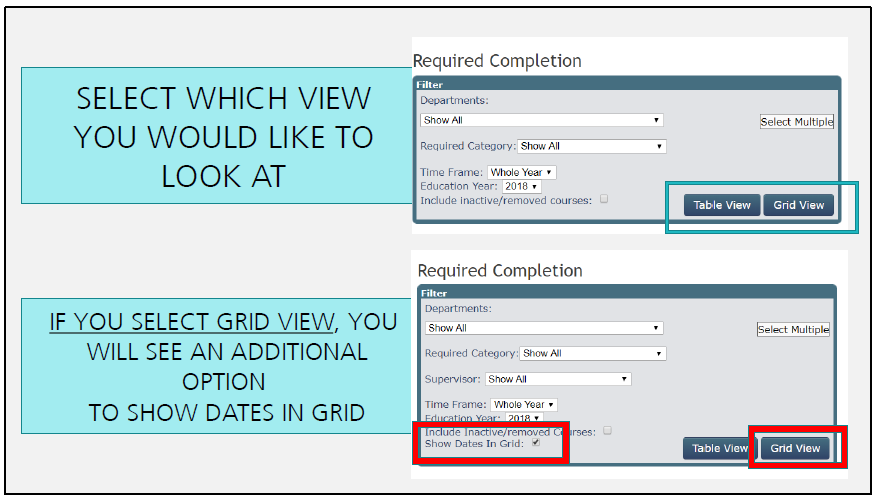
With Department Supervisor Access, You will only be able to view the staff within your department. So from this filter screen, click on whether you want to pull the table view or the grid view.
For yourselves, it would be probably MORE BENEFICIAL to look at the GRID VIEW because it is less clicks… and shows a bigger picture.

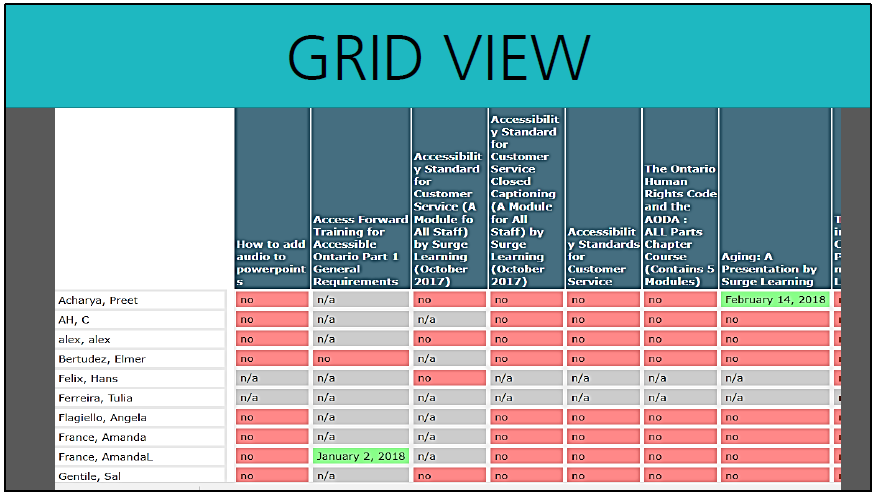
Grid View gives you an overall look at the staff within your department, the courses assigned, and what’s completed or not completed.
N/A means that person is not assigned the course
NO means they are assigned the courses but haven’t done it And the green reflects that it is done. If you DIDN’T use the checkbox in your filters to show dates in the grid, this will simply say YES (rather than the date of completion).
Click on the Employee’s Name to access the User Education Status Report. This report will show you specifically what assigned courses that staff member has and/or has not done. This report has filters so you can view just the courses that are not completed, OR show the courses that are completed, or view all
assigned courses whether complete or incomplete.
Table View shows you the title of the course assigned, the department to whom it’s assigned to, course length, due date, and percentage of completion. The values (numbers) will be reflective of YOUR department. So if it says 8 out 14 completed, it means that 8 of the 14 staff in your department have completed the course. To view who didn’t do it, you would click on the COURSE TITLE to see this information. Again this information displays well in the grid view, with less clicks to find the information you need
